 I have been using Research-based content marketing for more than 10 years. Sounds boring right?
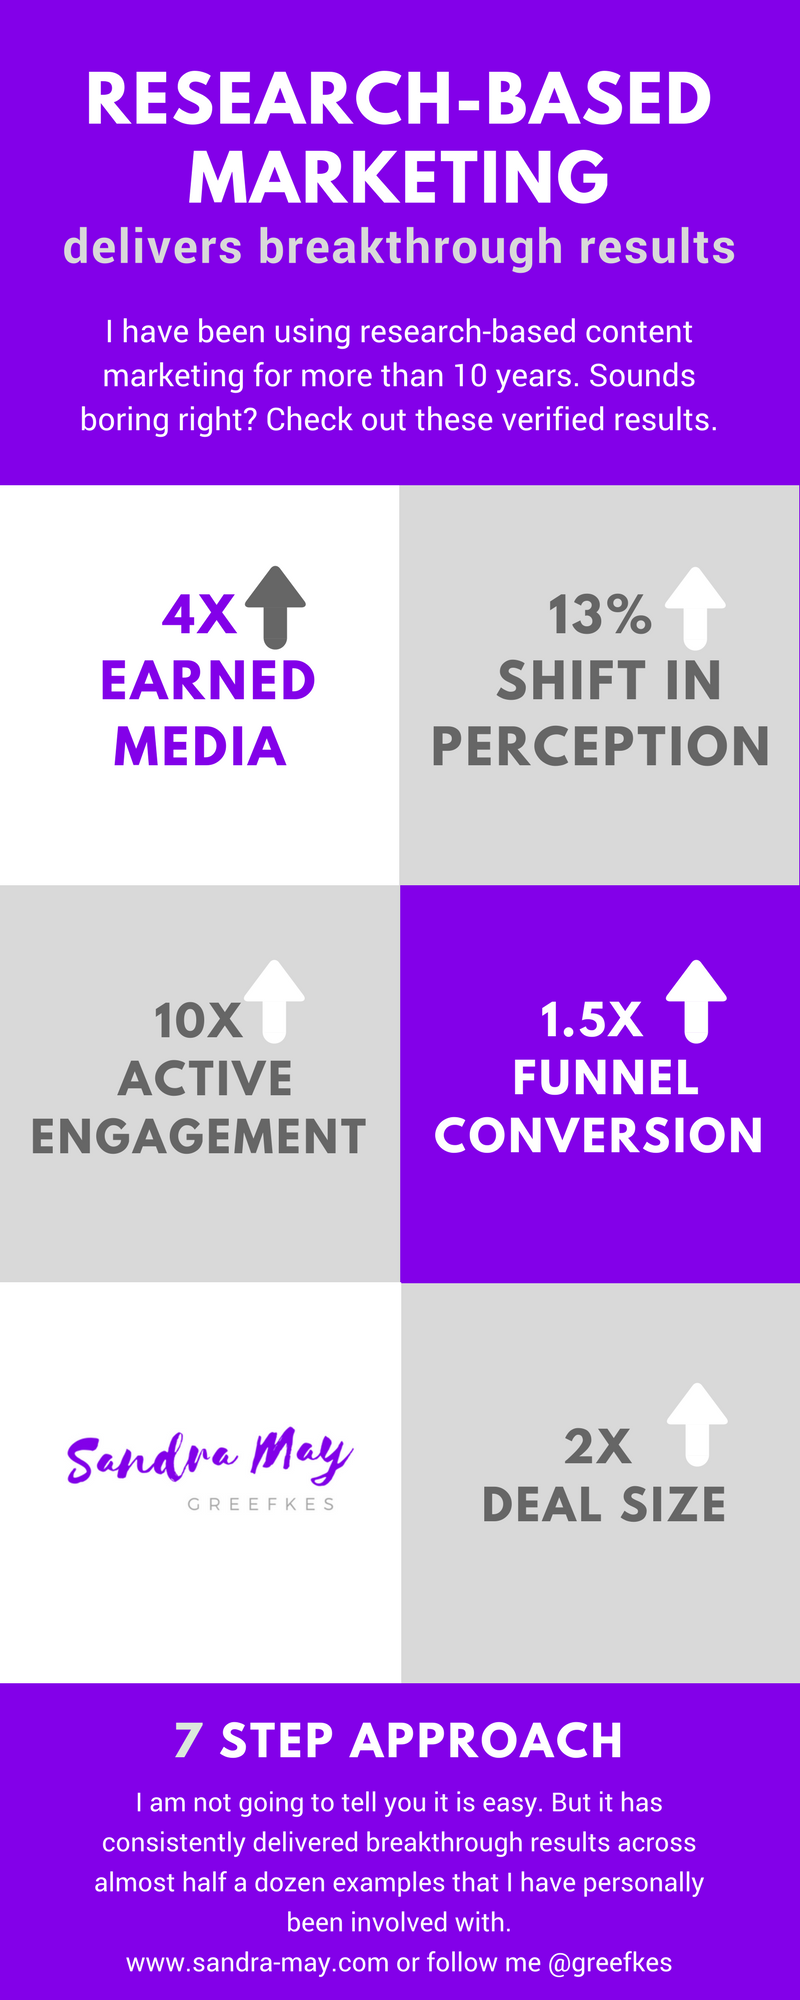
What if I told you that following this 7 step approach got results such as… a 4X increase in earned media, a 13% positive shift in perception, a 10X increase in active engagement or an almost 1.5X increase in funnel conversion or 2X increase in deal size? Not so boring after all?
What is Research-Based Marketing?
Let me start with what it is not. This is not about curating content. This is not about putting forward an opinion. This is not about building an online community or a following.
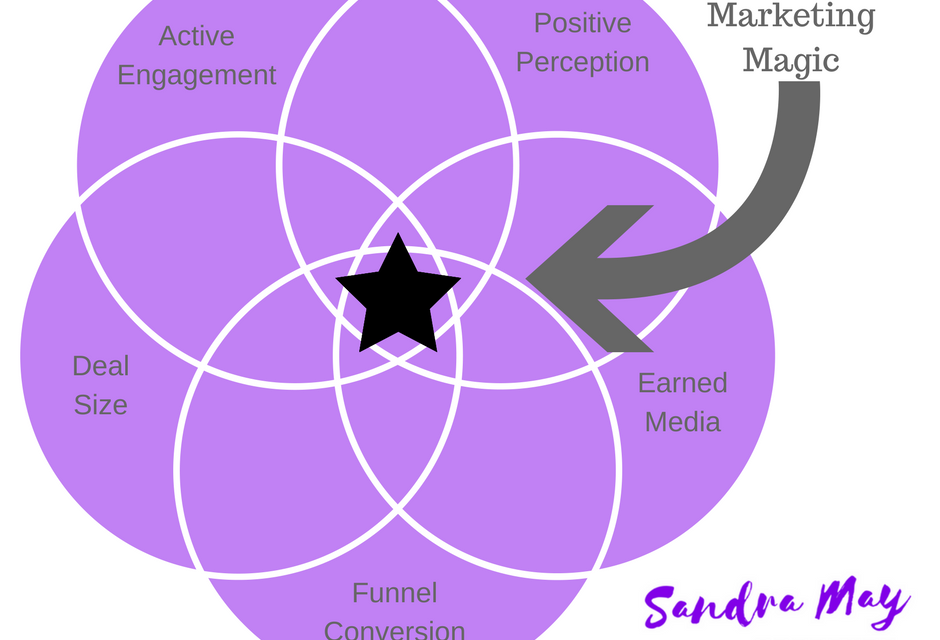
From my perspective research-based content marketing has the following components:
A) it establishes a unique and teachable thought leadership position and communications approach.
B) it engages customers and prospects in the research.
C) it combines brand and demand generations campaigns together in a manner that enables engagement
D) it delivers real value to customers and prospects by engaging them with information that is of significance to them and teaches them something new.
Enough about what it is and what it is not, let’s just get on with the nuts and bolts of “how?”
Step 1. Select a “thought leadership” focus area or even better “commercial insight” (a term coined by the CEB).
This first step is the very hardest part. Give it the time, attention and thoughtfulness it deserves. Let’s be clear, this is not about your brand, your product or your solution. It’s about your customer’s business.
Below are some thought starters for you.
- What significant and enduring customer problem do your offerings address?
- What would fundamentally change your customer’s business that you can help them with?
- What is your company uniquely great at, that is sustainable and that transforms your customer’s business?
- What are the things that would set your “star” customers apart from their competition?
- Which unique strengths does your company have that are under appreciated by your customers?
- What topics are relevant and compelling to your customers? (Hint: use digital insight to find this out)
- What are the things that your customer does not recognize that leads them to undervalue your strengths or the potential for your offering to provide their business a transformation?
- What problem does your customer have, don’t know they have and/or don’t know how to solve?
- What kind of content would you need to put in front of your customer to get them to do something different about their business or change their thinking about their business?
- What burning platform/content would spur a behavior change in your customer or a change in action?
- What topic provides your customer new insight and challenges them about their business?
Once you have chosen your topic – test it. Is it about your customer’s business and how it can be transformed? Does it provide your customer with new insight or challenges them about their business? Does it help your customer uncover a problem they didn’t know they had? Does it lead back to your companies unique strengths? Is it a potential area of monetization for your company? If you answered no to these questions…you don’t have the right topic yet. Oh and don’t teach your customer about something that you can not help them with better than anyone else.
Step 2. Build a research instrument and gather data from your target audience.
- Collaborate with your thought leaders and customer.
- Consider a “best practice” approach to your research.
- Detail the hypothesis you are testing.
- Develop and validate the research instrument.
- Complete quantitative research to test the hypothesis of the topic area.
Sample size matters! You have to remember that you want to be able to provide insight to your customer that is compelling and relevant. There is nothing more compelling and relevant than providing insight that is based on a large enough sample size for their domain. Their domain may be as simple as company size, industry or business type. In other cases their domain may be more specific – the research analysis will likely uncover this. Invest in a big enough sample that you can slice the data in a couple of different ways.
Many organizations attempt to do this research themselves using the various data analytic platforms available or a traditional research firm. However, in my experience, it is worth partnering with a Research-based Marketing company. They are experts at building the instrument, analysis, and synthesis to get to the comparatives that are critical to the remaining steps.
Step 3. Analysis and synthesis of the data, highlighting comparatives results and create best-practices benchmarks.
In some cases, your customers don’t want to learn from you. Instead, they want to learn from those that are experts or have done it and obtained amazing results. Sometimes they go seeking this information themselves and do so in a qualitative way. But what if you were in a position to give them quantitative insight? Wouldn’t that change their perception of your organization? So approach the data analysis broadly and deeply. We are not building an infographic with a few percentages. We are looking for comparatives that are statistically significant from a cause and effect perspective. Collaborate with your thought leaders in your organization about the research results. Synthesis the results into specific findings. Link back to the original hypothesis of the topic area and summarize with comparatives. Ideally, this research results will provide the best practices for your topic and how they relate to business results that are important to your customer.
Given these considerations, I recommend approaching the data analysis broadly and deeply. We are not building an infographic with a few percentages. We are looking for comparatives that are statistically significant from a cause and effect perspective. Collaborate with the thought leaders in your organization about the research results. Synthesize the results into specific findings. Link back to the original hypothesis of the topic area and summarize with comparatives. Ideally, these research results will provide the best practices for your topic and how they relate to business results and transformation opportunities that are important to your customer.
Comparatives that should be examined include role, function, industry, public versus private versus not-for-profit, high performers vs low performers, company size, geography to name the most common. Comparatives are the key to driving engagement and interaction.
Oh and if you want to be able to deliver insight on best practices – well those should have been part of the research instrument in step 2. See what I mean about partnering with a Research-based marketing organization? And no I don’t work for one – but would be happy to refer.
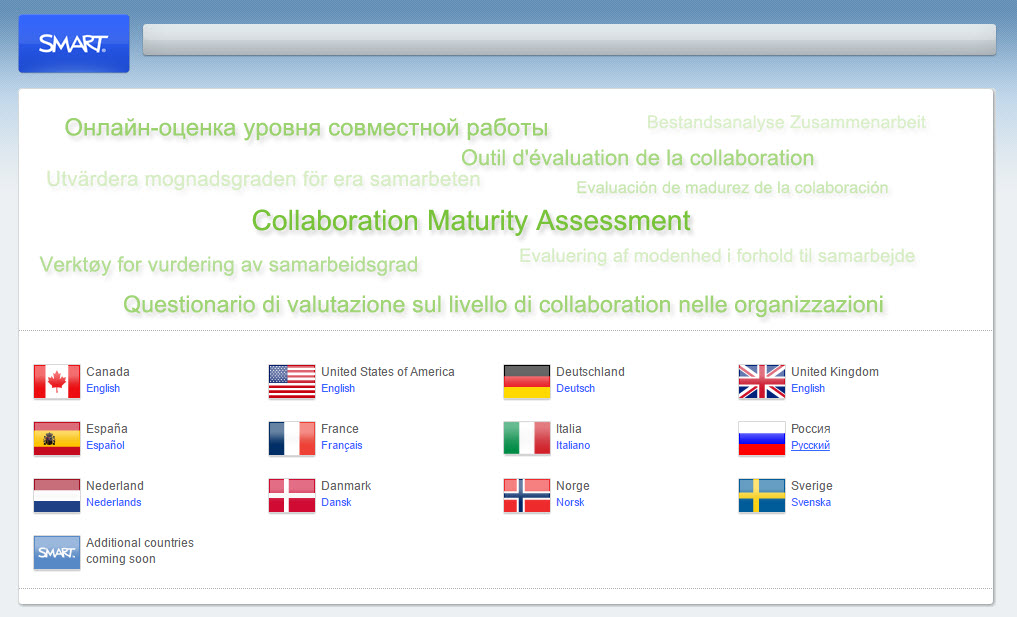
Step 4. Create interactive & social experiences.
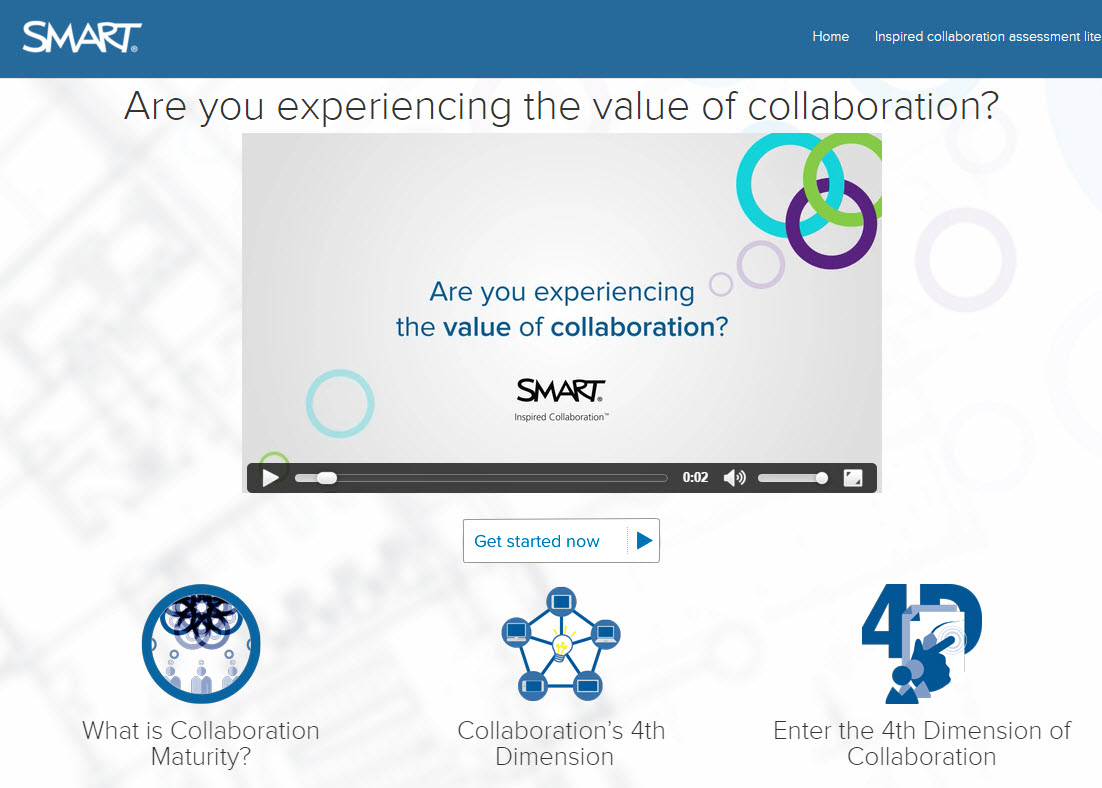
This content approach is incredibly digital friendly. Create an interactive or social experience using the research instrument. Leveraging the original research results using a weighted data model based on the comparatives that are statistically significant and deliver personalized ratings and comparisons to the participant. Deliver customized results and recommendations in real time. Capture their answers to add to the research database. This allows your to have a research project that is continually infield, provides refreshed input, larger samples over time and a continual source of refreshed content.
Here are a couple of examples to bring this approach to life.
Step 5. Ensure an integrated marketing approach and use the research to support story making.
There are many content delivery choices and information gathering mechanisms. The interactive experience that was created in Step 4 can be used to increase the number of customers entering in your AIDA funnel (Awareness, Interest, Desire, Action) and will accelerate your customer through the funnel.
Here are just a few ideas related to integrated marketing tactics:
- Digital Marketing including social platforms and other relevant communities
- Bring the Research results via video
- Collateral, Infographics, Research briefs, and Whitepapers – about the research results and a call to action to participate in the research
- Advertising (all types) – with a call to action to participate in the research and get a customized report
- Speaking Engagements, Trade Shows, Events and Seminars – use these digital experiences to support speaking engagements and interactive presentations, drive engagement and memorableness at event kiosks,
- Public, Media, and Analyst Relation activity – The research results are a great way of being able to pitch story ideas and industry news uniquely to various public relations, media relations and analysts.
- Internal Communications with Sales Force – Engage your sales organization with a drip campaign of the research results, how their customers are engaging and next steps.
- Leverage the research results and the customer specific customized results and recommendations to help story making come to life.
Step 6. Leverage the research to deliver value.
Develop a Sales Presentation that enables customization with their client’s results and recommendations. Incorporate these into sales calls so that they become more consultative in nature. Leverage through social prospecting activities. Does the research provide value to other parts of your organization? What about as an input to business intelligence or corporate strategy? Would product Development benefit from understanding this customer insight? How about Customer Support?
Is the delivery of the research results and recommendation a point of monetization for your company? Would your customers pay you for the professional services that this research support?
Step 7. Measure results and adjust/modify.
Track the results of your marketing mix with the research and tool in the field and optimize the mix that drives the most traffic into the tool or accelerates the sales funnel the fastest. Do more of what works and less of what doesn’t. The beauty of using the research instrument as a lead generation tool is that you capture all the data and the resulting behavior.
Below are just a few potential measurements to get you started.
- the number of research papers fulfilled, downloaded or shared.
- Social media measurements such as share of voice on the topic, engagement, sentiment, shares, etc.
- Percentage of utilization by various parts of the organization
- Percentage of utilization by your sale professionals with their customers
- Number of tool registrations and completed assessments
- Number of MQLs, SQLs, and closed deals
- Size of deals with and without the tool/research
- Speed of conversions
Research-based Marketing Delivers Breakthrough Results
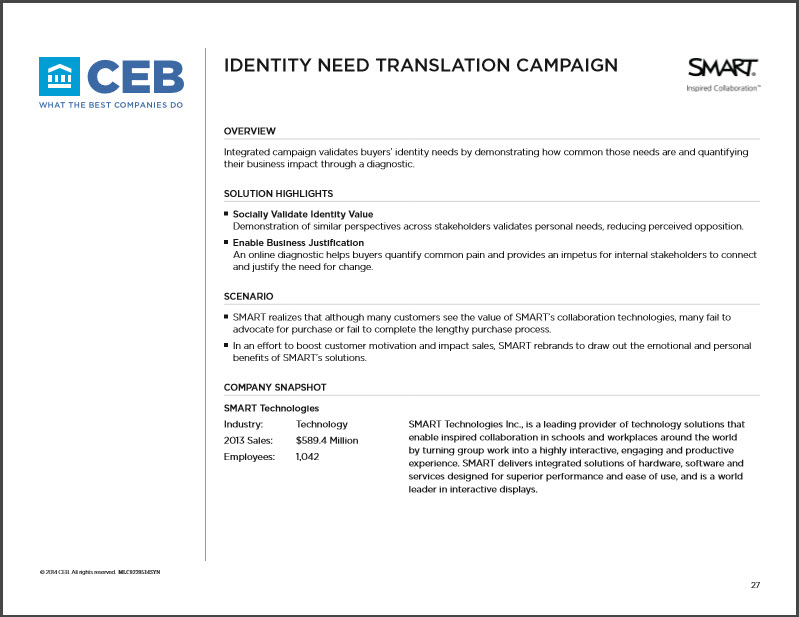
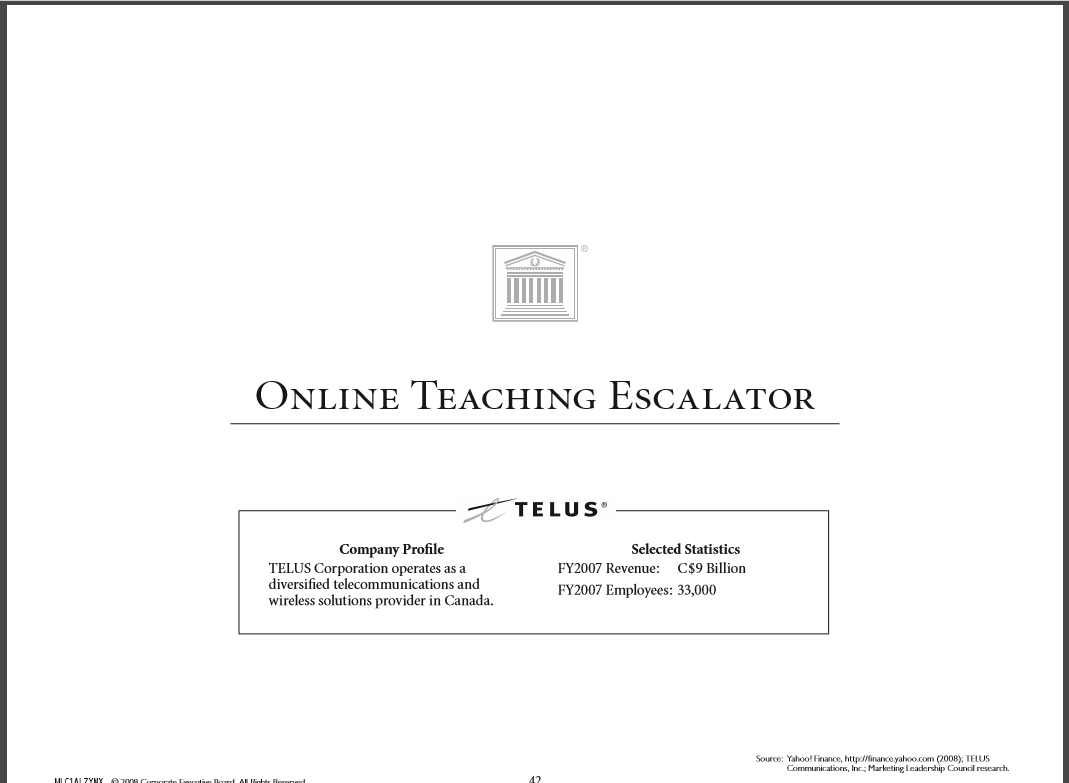
I am not going to tell you it is easy. But it is cost effective and in my experience has consistently delivered breakthrough results across almost half a dozen examples that I have personally been involved with. Here are a few best-practice case studies based on these projects from the Corporate Executive Board.
Found this helpful? Please share. Think I missed something? Please let me know or comment below.
Follow me @greefkes or @maygreefkes on most social sites.
At my core, I am a community builder – reach out to me for a 10-minute marketing best practice discussion.